🎯 Key Takeaway
- Learning how to check if seo is working is mostly a matter of setup, because the honest comparison needs a baseline you recorded before the work started
- Split searches for your own name from searches for the service, since branded traffic rises for reasons that have nothing to do with search work
- Mark the action you care about as a key event, or the enquiries stay invisible in the reports you actually read
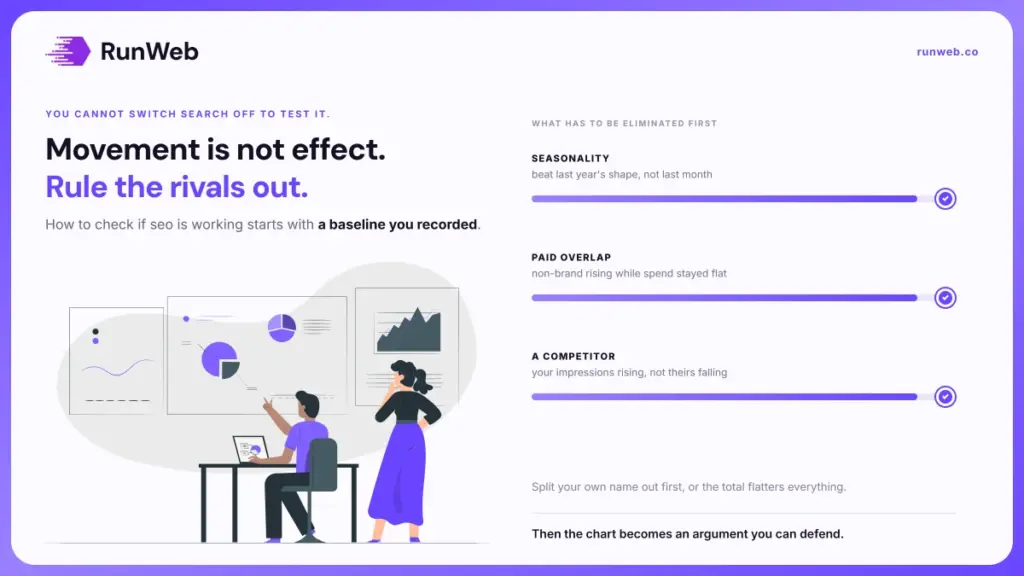
- Rule out seasonality, paid overlap and a competitor’s change before you credit or blame the work
- You cannot switch search off for a month to test it, which is exactly why the setup has to come first
Rankings can climb for a month while the business feels exactly the same.
But the report you get will lead with those rankings. They chart well. So the question rarely gets answered by the document that was written to answer it.
What settles it is a modest amount of setup, done before you need the answer, plus the habit of ruling things out.
So here is the check itself, and the three rival explanations it has to eliminate first.
Why the dashboard cannot answer it
Every SEO dashboard shows movement. Movement is not effect. A chart that goes up tells you something changed without telling you what caused it.
That limit is structural rather than a flaw in any particular tool. Ahrefs’ work on measuring SEO ROI names the reason directly: unlike paid channels, you cannot pause SEO to measure incrementality without risking long-term damage.
Because the work cannot be switched off for a control period, the only honest comparison is against a baseline you wrote down before it started.
What that means in practice
Nobody can prove causation here to a laboratory standard, and pretending otherwise is how vendors get away with vague reporting. Narrowing is the goal. What you can do is cut the field down until one explanation is far more likely than the others.
Which is a lower bar, and it’s reachable with two free tools and about an hour of setup. So the work is front-loaded, and the payoff arrives every month afterwards.
Separating your name from real demand
That narrowing starts with one split. It matters more than any metric. Searches for your company name behave nothing like searches for the service you actually sell.
Branded searches rise when you advertise, when a van gets seen, when somebody recommends you at a barbecue. None of that is search work. Yet all of it lands in the same organic total and quietly flatters it.
Google’s Search Console performance report is where the split gets made, since it reports clicks, impressions, CTR and average position across dimensions including queries, pages, countries and devices.
- Filter queries to exclude your business name: Include the common misspellings too, because customers type those more than you would expect.
- Save that filtered view and use only it: The unfiltered total is the number a weak report will quote at you, so stop looking at it.
- Compare like periods, not consecutive ones: Set this month against the same month last year, which removes most of the seasonal noise for free.
- Watch impressions before clicks: Impressions move first when new pages start being shown, so they are the earliest honest signal you have.
Once non-brand impressions and non-brand clicks are both rising, you have evidence that is hard to explain any other way. And if the total is rising while the non-brand half is flat, the work is not what is producing the change.
Instrumenting the outcome you care about
That evidence still stops short of the thing you actually sell, which is booked work. Traffic is a proxy, and proxies drift.
Google’s documentation on analytics events defines a key event as an action that’s particularly important to the success of your business, and warns that custom events don’t show up in most standard reports, so you need to set up custom reports or explorations.
- Pick one action and name it: A submitted enquiry form, or a call over ninety seconds, chosen before you look at any data.
- Mark it as a key event: An unmarked event exists in the data and is absent from every report you will actually open.
- Count calls as well as forms: Trades businesses take most enquiries by phone, so a forms-only setup misses the majority of the result.
- Record the baseline number: Enquiries per hundred non-brand visits, written down with today’s date on it.
- Check it lands before you rely on it: Submit a test enquiry and confirm it appears, since silent tracking failures run for months.
Each of those takes minutes, and skipping the last one is the common mistake. Test it today. A form that quietly stopped reporting in March turns every later comparison into fiction.
Where the enquiry never arrives despite the traffic, the site is the constraint rather than the search work, and page count plus the enquiry path is the place to look.
The three explanations to rule out
Suppose the non-brand numbers and the enquiries both moved. Do not celebrate yet. Before crediting the work, three rival explanations need eliminating, and each one has a specific test.
| Rival explanation | How to test it | What clears it |
|---|---|---|
| Seasonality | Compare the same month a year earlier | A rise that beats last year’s shape, not just last month |
| Paid overlap | Check whether ad spend changed in the window | Non-brand organic rising while spend stayed flat |
| A competitor’s change | Look at impressions, not only clicks and position | Your impressions rising rather than theirs falling |
| Site changes unrelated to search | Check the change log for redesigns or new pages | No structural edit inside the comparison window |
Read the middle column as the whole method. None of those tests takes more than a few minutes, and running all four is what turns a chart into an argument you could defend.
The paid overlap one catches people out most often, because search and advertising get judged together when the budget is tight. How to separate them is covered in a small budget, and boosting versus campaigns makes the same point on social.
The numbers that mislead most often
Those four tests also expose which figures were never worth watching. Five appear in almost every report and answer almost nothing.
- Total organic traffic: Carries your branded searches inside it, so it rises when your reputation does rather than when the work does.
- Average position across all queries: One irrelevant query entering or leaving the set moves this number without anything real changing.
- Keywords in the top ten: Counts terms rather than demand, and a hundred terms nobody searches for is a bigger number than three that convert.
- Impressions on their own: Useful early as a leading signal, misleading later, since being shown more often is not being chosen more often.
- Domain-strength scores: Third-party estimates of authority, which no search engine uses and which nobody buying from you can see.
Two more things worth knowing before you argue
Search Console labels its newest records as preliminary data that might change in the next few hours, so a fresh number is not yet a fact. Analytics has its own window, ignoring events that arrive more than two calendar days plus today after they happened.
Meaning a Monday-morning panic about Friday’s figures is usually about the reporting delay rather than the business. So let the week close first.
Building the one check you repeat
All of that collapses into a short monthly routine. Keep it boring. Five entries, the same five every time, kept in one place so the comparison stays possible at all.
- Non-brand clicks and impressions: From the saved filtered view, against the same month last year.
- Enquiries per hundred non-brand visits: The number that turns traffic into something your diary recognises.
- What changed on the site: Pages added, edited or removed, with dates, because next month’s question depends on it.
- What changed off the site: Ad spend, a competitor’s new pages, a seasonal event, or a review milestone.
- The one-line verdict: Better, flat or worse against your own baseline, written before you read anyone else’s report.
Semrush’s guide to the ROI formula reduces the money question to organic revenue minus costs, divided by costs, which only works once entry two is real. Until the enquiry is counted, the formula has nothing to put in its numerator.
How long each part should take before a verdict is fair is set out in how long SEO takes, and separately in the local clock where map visibility runs on its own schedule. For a trades business doing this across several towns, SEO for contractors covers what to expect per area, and hiring a maps provider covers holding an outside team to the same numbers.
When you would rather the baseline, the tracking and the monthly comparison were part of the engagement instead of an afterthought, that is how our SEO work is set up.
Frequently Asked Questions
My rankings improved but nothing else did. What broke?
Usually the page, not the search work, since a term you rank for can carry no buying intent at all. Check whether the visits arriving from it ever reach an enquiry, and whether the page asks for one.
Can I trust a vendor’s own reporting tool?
Treat it as a summary of a source you also hold, and insist that the underlying accounts stay in your name. A vendor tool that cannot be reconciled against Search Console is a presentation rather than evidence.
How far back should my comparison window go?
Year-on-year for the same calendar month removes the seasonal distortion that month-on-month introduces. Keep at least thirteen months of your own records so that comparison is always available.
What if a competitor simply outspent us?
Their gain shows up as your impressions holding steady while your clicks fall, which is a different shape from losing visibility. That distinction decides whether the answer is better pages or a different query set.
Does an AI answer above the results change any of this?
Impressions can hold while clicks soften when an answer sits above the links, so the click-through rate becomes the figure to watch. The method itself does not change, though the enquiry count matters even more.